The Net Promoter Score (NPS) is a highly effective measurement tool for assessing customer satisfaction. It is based on a single question: “would you recommend our brand to others?” The responses help evaluate brand awareness, customer loyalty, and the effectiveness of marketing team initiatives in achieving customer satisfaction. NPS provides reliable indicators of your company’s growth prospects. Here’s how and why to measure it.
>> Create a customer satisfaction survey on Drag’n Survey, click here
Why is NPS so important?
The Net Promoter Score is one of the most relevant indicators for measuring and predicting a company’s success through customer satisfaction.
Predictive indicator of company growth
The Net Promoter Score (NPS) provides valuable insight into the company’s future growth dynamics, allowing for trend anticipation and strategic action adjustment.
Simple and actionable measure
The strength of NPS lies in its simplicity: a single question generates a clear score that’s easily actionable, making its implementation and monitoring particularly effective.
Easily comparable across companies and sectors
Thanks to its standardized methodology, NPS enables relevant comparisons not only between direct competitors but also across different industry sectors, providing a broader perspective on performance.
Proven correlation with long-term profitability
Numerous studies have demonstrated the direct link between high NPS and companies’ financial performance over the long term, confirming its role as a strategic indicator for decision-making.
How to calculate the Net Promoter Score?
The Net Promoter Score is one of the common indicators in measuring customer satisfaction. It particularly helps highlight customer loyalty and identify potential company ambassadors. The score is easy to interpret. It serves as a basis for judging the impact of loyalty and communication campaigns. NPS also allows for comparison with competing companies within the same industry sector.
The fundamental question
NPS is based on a single question: “On a scale of 0 to 10, how likely are you to recommend our company/product/service to a friend or colleague?“
The three respondent categories
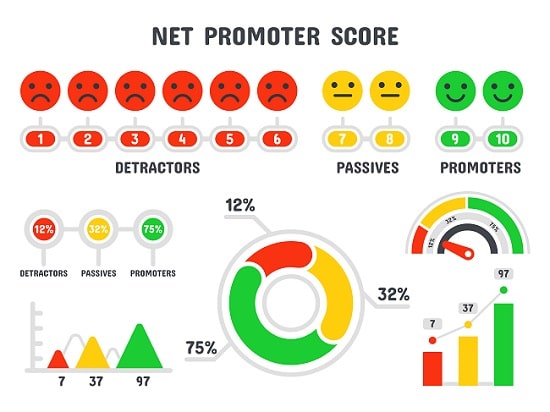
This customer satisfaction indicator classifies buyers into three categories.
1. Promoters (scores 9-10)
A score of 9 or 10 defines consumers as:
- Highly satisfied and loyal customers
- Active brand ambassadors
- Generators of positive word-of-mouth
2. Passives (scores 7-8)
A score of 7 or 8 defines buyers as:
- Satisfied but not enthusiastic customers
- Buyers vulnerable to competitive offers
- Potential future promoters
3. Detractors (scores 0-6)
A score of 0, 1, 2, 3, 4, 5, or 6 defines consumers as:
- Dissatisfied customers
- A risk for negative word-of-mouth
- Priority targets for company corrective actions
NPS calculation formula
The formula for calculating the Net Promoter Score is:
- NPS = Percentage of promoters (scores 9 and 10) – Percentage of detractors (scores 0 to 6)
Concrete example of Net Promoter Score calculation
Out of 100 respondents:
- 45 promoters (45%)
- 30 passives (30%)
- 25 detractors (25%)
With a detractor percentage of 25% and a promoter percentage of 45%, the NPS = 45% – 25% = 20
An absolute number indicator
The Net Promoter Score is not expressed as a percentage, but as an absolute number (without decimals), ranging from -100 to +100.
While the score matters, it’s primarily its use over time and its evolution that are significant. A large increase over a few months will demonstrate that buyer satisfaction is rising sharply. It’s also important to use this indicator as a comparison tool between products of the same brand and with competitors.
Sector benchmarks and concrete examples
Average NPS by sector (2024)
| Sector | Average NPS |
|---|---|
| E-commerce | 45 |
| Traditional retail | 30 |
| Financial services | 34 |
| Telecommunications | 25 |
| Hospitality | 47 |
| Automotive | 44 |
Market leaders and their performance
Apple – NPS: 61
Apple shows an NPS of 61 in the technology sector. The apple brand achieves a high score thanks to three main aspects. First, it offers a harmonized customer experience across its different products and services. Second, its after-sales service responds to customer requests quickly. Third, the company maintains a regular rhythm of updates and new features for its products.
Amazon – NPS France: 44
In France, Amazon has an NPS of 44 in the e-commerce sector. The company stands out for three main characteristics. First, it has a logistics network that ensures deliveries within announced timeframes. Second, its platform offers an extensive range of products across many categories. Finally, its customer service is structured to quickly handle various user requests throughout the year.
The Net Promoter Score, a clear and concrete indicator
Used by many companies, it has the advantage of being readable and explicit for all employees and managers. It effectively visualizes the results of a campaign or measures taken for buyer satisfaction. This also makes it an excellent tool for team motivation, as they can concretely see the effects of their work. However, it’s important to evolve with the right reading grid. Indeed, the interpretation of results must take into account the nature of the brand being surveyed, the type of products, the culture, and the countries where the responses come from. It is therefore difficult to define standards in this area. However, we can estimate that:
- A score above 50 is very good
- A score above 0 is good. Even if you have detractors, you can count on a base of satisfied and loyal buyers.
Beyond NPS, the importance of analyzing customer comments
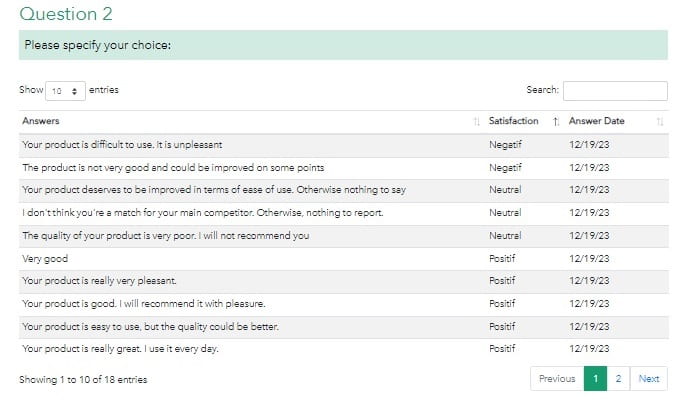
Beyond the score, the real value of the Net Promoter Score lies in the responses and comments provided by respondents. This is where the explanation for the given score can be found. Thus, the questionnaire should be accompanied by questions such as: “how can we improve our service?” for someone who gave a score from 0 to 6, or “what do you particularly like about our brand?” for promoters.
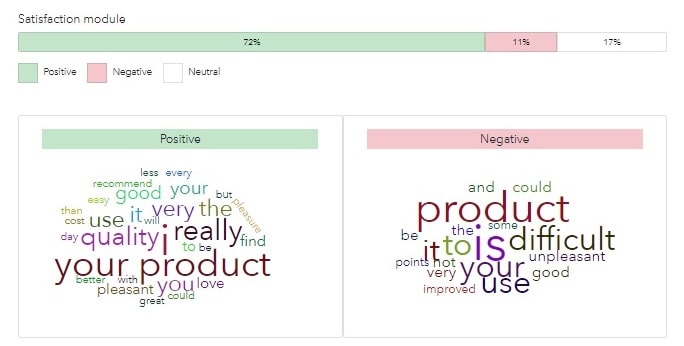
Regarding satisfaction comments, the online survey software Drag’n Survey has developed an artificial intelligence that scans the comment and specifies whether it is neutral, negative, or positive. A word cloud is also provided to see the positive and negative trends that emerge.
When and how to conduct an effective NPS survey
There are 3 different types of surveys to measure the Net Promoter Score. You can conduct a relationship, transactional, or follow-up survey.
Relationship surveys
These surveys are deployed to all customers at regular intervals, typically every three to six months. Their main objective is to measure overall customer satisfaction with the company. By surveying the entire customer base, these surveys provide an overview of brand perception and identify general satisfaction trends.
Transactional surveys
Transactional surveys are conducted immediately after a specific interaction with the company. They aim to evaluate customer satisfaction regarding a specific touchpoint, whether it’s a purchase, customer service interaction, or delivery. This method allows for collecting immediate feedback on key moments in the customer journey.
Follow-up surveys
Conducted several weeks after an interaction, follow-up surveys focus on evaluating medium-term satisfaction. They specifically examine the product or service usage experience over time. This approach helps understand how the customer perceives the offering after a period of actual use.
Best practices for NPS surveys
The success of an NPS survey relies on several key elements. To obtain relevant and actionable feedback, it’s essential to structure your approach following certain fundamental principles.
Choose the right time to survey your customers
The timing of survey deployment directly influences the quality and quantity of responses obtained. It’s important to adapt timing according to the type of survey: immediately after an interaction for transactional surveys, at regular intervals for relationship surveys, or after a usage period to evaluate long-term satisfaction.
Customize the questionnaire according to customer profile
Adapting the questionnaire to the context and customer profile helps obtain more precise and relevant responses. This involves considering the type of interaction, the customer’s history with the company, and their specific characteristics to formulate adapted questions that will generate actionable insights.
Implement a customer feedback tracking system
Following the collected responses, it is crucial to quickly analyze feedback and implement corrective actions when necessary. This involves having a clear process to handle negative feedback, identify recurring problems, and provide concrete solutions within appropriate timeframes.
Communicate on improvements made
Transparency about actions taken following surveys is essential. It’s important to inform customers about changes and improvements made based on their feedback. This communication demonstrates that the company is listening and taking concrete action to improve its services, which encourages participation in future surveys.
Strategies for improving Net Promoter Score
Effectively managing your Net Promoter Score requires a structured approach, particularly in handling detractors and passives.
Priority actions for detractors
Quick reaction
Detractors require immediate attention. Contact must be established within 24 hours of identifying a dissatisfied customer. Each case requires a solution adapted to the specific problems encountered. Regular follow-up then ensures that the solutions implemented meet customer expectations.
In-depth analysis
Beyond immediate reaction, a detailed analysis of dissatisfaction causes is necessary. This study allows for developing a targeted corrective action plan. Preventive measures are then deployed to avoid the repetition of similar situations with other customers.
Converting passives to promoters
Customer engagement
Passive customers represent an opportunity for improvement. Implementing an adapted loyalty program can strengthen their engagement. Regular personalized communications maintain the connection with these customers. Exclusive benefits can be offered to demonstrate the added value of the relationship.
Continuous improvement
Regular feedback collection from passives helps identify areas for improvement. This feedback guides product and service innovation. Continuous team training ensures better consideration of customer expectations on a daily basis.
Conclusion and best practices
The Net Promoter Score establishes itself as a strategic transformation lever for companies. Beyond a simple satisfaction indicator, it allows for quickly identifying priority improvement areas and mobilizing teams around concrete objectives. Regular measurement of action impact and market comparison provide an effective continuous improvement framework. For success, the essential thing is to integrate NPS into a global approach, supported by the entire organization.
Frequently Asked Questions (FAQ) about Net Promoter Score
🤔 What’s the difference between NPS and other customer satisfaction indicators?
NPS differs from other indicators (like CSAT or CES) in:
- Its simplicity: one main question
- Its long-term vision: it measures loyalty rather than immediate satisfaction
- Its predictive capacity for growth
- Its comparability across sectors and companies
📊 How often should I measure my Net Promoter Score?
- For relationship NPS: every 3-6 months
- For transactional NPS: after each important interaction
- For follow-up NPS: 2-3 weeks after product/service use The most important thing is the regularity of measurements to track evolution.
📈 What is a good NPS score?
It depends on your sector, but generally:
- Above 50: excellent
- From 0 to 50: good
- From -100 to 0: needs improvement
Note: Compare yourself primarily to your sector rather than absolute standards.
📱 Should we prioritize email or mobile surveys?
Both channels are complementary:
- Email: ideal for in-depth relationship surveys
- Mobile: perfect for post-interaction feedback
- Multi-channel: recommended to maximize response rate
🎯 What sample size is needed for reliable NPS?
To obtain statistically significant results:
- Minimum: 100 responses
- Ideal: 200-300 responses
- For large companies: 1000+ responses
📋 How to utilize respondent comments?
- Analyze verbatim by category (promoters/passives/detractors)
- Identify recurring themes
- Prioritize corrective actions
- Implement improvement tracking
- Communicate on actions taken
🚨 What to do in case of a sudden NPS drop?
- Quickly analyze causes:
- Recent company changes
- Technical problems
- Competitor actions
- Contact a sample of detractors
- Implement an emergency action plan
- Monitor evolution daily
💡 How to convert passives into promoters?
Effective strategies:
- Offer exclusive benefits
- Personalize customer relationships
- Anticipate their needs
- Communicate proactively
- Provide memorable experiences
🏢 Is NPS suitable for B2B companies?
Yes, with some adjustments:
- Measure at different levels (company, department, user)
- Consider longer decision cycles
- Adapt survey frequency
- Account for multiple decision-makers
🏪 How to use Net Promoter Score in retail?
Specific advice:
- Combine store NPS and brand NPS
- Measure after each significant purchase
- Train store teams on results
- Link NPS to loyalty programs
🌐 How to adapt NPS internationally?
Points of attention:
- Consider cultural differences in scoring
- Adapt question translation
- Adjust benchmarks by country
- Consider local specificities
📱 Which tools to use for tracking Net Promoter Score?
Recommended solutions:
- Dedicated platforms (Drag’n Survey)
- CRM integrating NPS
- Text analysis tools
- Customized dashboards
👥 How to involve teams in improving NPS?
Best practices:
- Regularly share results
- Link NPS to team objectives
- Train on improvement actions
- Celebrate successes
- Encourage initiatives
📊 How to use Net Promoter Score for decision-making?
Strategic applications:
- Investment prioritization
- Product development
- Team training
- Process improvement
- Marketing strategy

More about surveys:
Innovative Platforms for Your Online Quiz Needs, click here
Top Metrics for Measuring Customer Satisfaction, click here
Curating the Top 10 Tools for Seamless Online Surveys, click here
The Benefits of Tracking the Customer Satisfaction Score, click here
User-Friendly Online Survey Tools That Rival SurveyMonkey, click here
Explore the Top 5 Surveys and Form Tools Beyond Typeform, click here
Crafting Effective Options: Developing Multiple Choice Questions, click here
How to Measure Your Net Promoter Score with This NPS Calculator, click here
Upgrade Your Form Experience with 5 Superior Alternatives to Google Forms, click here
Elevate Your Customer Feedback with These 14 Key Satisfaction Survey Questions, click here
Read the article:
Polish – Co to jest wskaźnik Net Promoter Score? click here
German – Was ist der Net Promoter Score (NPS)? click here
French – Qu’est-ce que le Net Promoter Score (NPS) ? click here
Portuguese – O que é a pontuação de promotor líquido (NPS)? click here
