Net Promoter Score (NPS) has become the benchmark indicator for measuring customer satisfaction since its creation by Bain & Company in 2003. Simple yet powerful, this measurement tool allows companies of all sizes to evaluate customer loyalty and predict their growth.
>> Tips for a successful NPS survey, click here

NPS Calculator
Use our interactive NPS calculator below to get your Net Promoter Score instantly. Simply enter the number of responses received for each rating.
Free NPS Calculator
How to Calculate Your NPS: Step-by-Step Method
1. The Basic Formula
The NPS calculation is based on a simple formula:
NPS = % of Promoters – % of Detractors
2. Identifying Respondent Categories
For accurate NPS calculation, it’s essential to understand each respondent category and their impact on the final score.
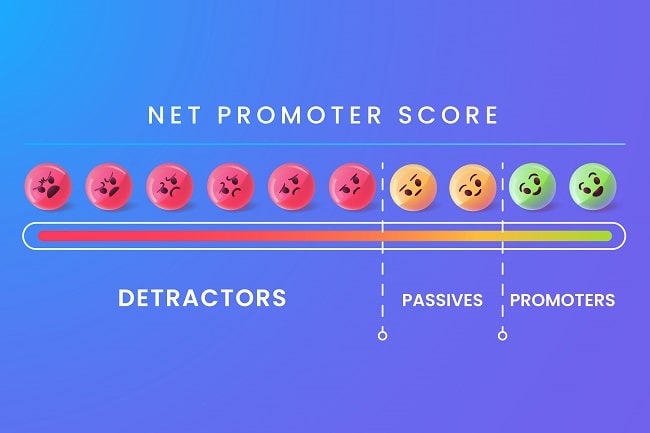
Detractors (0-6)
These dissatisfied customers represent a risk for your company:
- Scores from 0 to 2 indicate a very negative experience requiring immediate action
- Scores from 3 to 4 signal major problems in the customer experience
- Scores from 5 to 6 reveal moderate but significant dissatisfaction
Each detractor counts negatively in your NPS calculation, hence the importance of identifying them to implement corrective actions.
Passives (7-8)
Although not counted in the final NPS formula, these customers are strategic:
- A score of 7 indicates basic but fragile satisfaction
- A score of 8 shows adequate satisfaction but without enthusiasm
- These customers can easily shift toward becoming detractors or promoters
Promoters (9-10)
These highly satisfied customers are your best ambassadors:
- A score of 9 represents excellent satisfaction
- A score of 10 indicates maximum delight
- Each promoter counts positively in your NPS calculation
3. Concrete NPS Calculation Example
Let’s take a detailed practical case to understand the NPS calculation step by step.
Initial Situation
Imagine a company that has collected 250 responses distributed as follows:
Detractors (0-6)
- Scores 0-2: 15 responses
- Scores 3-4: 25 responses
- Scores 5-6: 45 responses
Total detractors: 85 responses
Passives (7-8)
- Score 7: 65 responses
- Score 8: 35 responses
Total passives: 100 responses
Promoters (9-10)
- Score 9: 40 responses
- Score 10: 25 responses
Total promoters: 65 responses
Detailed Calculation
1. Calculating the percentage of detractors
(85 ÷ 250) × 100 = 34%
2. Calculating the percentage of promoters
(65 ÷ 250) × 100 = 26%
3. Final NPS calculation
NPS = 26% - 34% = -8
Result Analysis
In this example:
- The negative score (-8) indicates a need for improvement
- The significant proportion of passives (40%) represents an opportunity for conversion to promoters
- The high number of 5-6 scores (45 responses) suggests customers close to becoming passives
Impact of Variations
To understand calculation sensitivity:
- If 10 detractors become passives: NPS rises to -4
- If 10 passives become promoters: NPS rises to -4
- If both changes occur simultaneously: NPS rises to 0
This detailed understanding of the calculation allows you to:
- Better target improvement actions
- Predict the impact of corrective actions
- Establish realistic NPS evolution objectives

Tips for Accurate NPS Calculation
Precision in Net Promoter Score calculation plays a crucial role in the reliability of your customer satisfaction data. While the formula seems simple, certain points deserve special attention to avoid interpretation errors.
The Passive Trap in Calculation
The most common error concerns the treatment of passive customers. These customers, who give a score of 7 or 8, often represent a significant portion of responses. However, their role in the final calculation is often misunderstood.
Contrary to common belief, passives should not be integrated into the final NPS formula. Their only function is to participate in calculating the total percentage of respondents. Including them in the final subtraction risks significantly underestimating your score.
For example: Out of 100 responses, if you have:
- 30 promoters (scores 9-10)
- 40 passives (scores 7-8)
- 30 detractors (scores 0-6)
The correct calculation will be: 30% – 30% = 0 And not: 30% – 70% = -40%
The Importance of Sample Size
The reliability of your NPS depends directly on the number of responses collected. A minimum of 100 responses is necessary to obtain a representative score. Below this threshold, a single response can have a disproportionate impact on your final score.
For finer analysis, particularly if you wish to segment your results by customer type or product, ideally aim for between 200 and 300 responses. This broader base will allow you to identify significant trends in each segment without risking hasty conclusions based on too small samples.
Rounding Management: A Detail That Counts
The treatment of decimals may seem trivial, but it directly impacts your score’s accuracy. Here’s the recommended method:
- Keep all decimals in your intermediate calculations
- Only round at the final calculation stage
- Always round to the nearest whole number
When and How to Calculate Your NPS
The timing of your NPS calculation directly influences the relevance of the insights you’ll gain from it. There isn’t a single ideal moment, but rather different measurement opportunities, each providing specific insight into your performance.
Post-Purchase NPS Calculation: Capturing Emotion
Immediate measurement, conducted 24 to 48 hours after a transaction, allows you to capture customers’ fresh feedback. This is a crucial moment when the purchase experience is still fresh in their minds. Feedback collected at this stage is particularly valuable for:
- Identifying friction points in your purchase process
- Evaluating customer service performance
- Detecting delivery or first-use issues
A low score at this stage requires rapid action to prevent negative word-of-mouth spread.
The Cool-Down Measure: Evaluating Sustainable Satisfaction
A second measurement, conducted 2 to 4 weeks after purchase, offers a different but equally valuable perspective. At this stage, your customers have had time to:
- Fully use your product
- Explore its features
- Form an opinion based on experience rather than emotion
This measurement is particularly relevant for complex products or services requiring a learning period.
Regular Cycle: Tracking Trends
Beyond one-time measurements, implementing a regular NPS calculation cycle is essential for tracking customer satisfaction trends over time. It is recommended:
For B2B: Quarterly calculation allows tracking satisfaction evolution while giving corrective actions time to bear fruit.
For B2C: Semi-annual measurement offers a good compromise between reactivity and statistical relevance. It also helps avoid respondent fatigue.
2024 NPS Benchmark: Compare Yourself to Your Sector
To give meaning to your NPS score, it’s essential to compare it to the averages in your industry. Each industry has its specificities and standards, and a score considered excellent in one sector might be average in another.
High-Performing Sectors (NPS > 40)
- E-commerce (45): Overall sector leader, driven by mature players in customer experience and ease of offer comparison.
- B2B SaaS (42): Excellence driven by customer support and continuous innovation.
- Hospitality (40): Sector historically oriented toward customer satisfaction.
Intermediate Sectors (NPS 30-40)
- Insurance (35) and Financial Services (34): Sectors in digital transformation with growing attention to customer experience.
- Traditional Retail (30): Progressing through omnichannel and integration of customer feedback in continuous service improvement.
Lagging Sectors (NPS < 30)
- Transportation (28): Operational challenges impacting customer satisfaction, particularly in terms of punctuality and incident management.
These benchmarks allow you to position your performance and identify your improvement potential. Note that these averages mask significant disparities: sector leaders often exceed 50 NPS points, showing that excellence is possible regardless of your field.
💡 Expert Advice: Don’t just compare yourself to your sector’s average. Instead, aim for the performance of the top 25% of players in your industry to build a sustainable competitive advantage.
This sectoral positioning should serve as a basis for your continuous improvement strategy. Gaps with sector leaders can be explained by several factors:
- Company’s digital maturity
- Quality of team training
- Management’s commitment to customer culture
- Efficiency of customer feedback processing
To progress, focus on identifying best practices from sector leaders while considering your specificities. The goal isn’t to copy but to draw inspiration for building your own operational excellence.
Interpreting Your NPS Score: Beyond the Numbers
Net Promoter Score interpretation requires nuanced analysis that goes well beyond simply reading a number. This metric, ranging from -100 to +100, takes on its full meaning when contextualized and analyzed in depth.
Decoding Score Variations
A significant variation in your NPS always deserves thorough analysis. Here’s how to interpret these changes.
Sudden Drops
A sudden drop of more than 10 points should trigger immediate investigation. It may result from several factors:
- A recent change in your processes
- A modification of your offering
- An undetected technical issue
- An evolution in customer expectations
In this case, prioritize qualitative analysis of customer comments to quickly identify the source of the problem.
Progressive Improvements
A regular increase of 2 to 5 points per quarter typically demonstrates an effective continuous improvement strategy. This “healthy” progression indicates that:
- Your corrective actions are bearing fruit
- Your understanding of customer expectations is becoming more refined
- Your teams are embracing customer culture
Segment Analysis: Refining Understanding
Segmenting your NPS provides valuable insights for steering your improvement strategy. It’s important to consider customer tenure and sales channels.
Customer Tenure
Comparing NPS between new customers and historical customers reveals the quality of your onboarding process and the evolution of your value proposition. A significant gap might indicate:
- Problems in new customer integration
- A positive evolution of your offering
- A disconnect between marketing promise and reality
Sales Channels
Analyzing NPS by distribution channel helps identify best practices and weaknesses in each circuit. For example, a higher NPS on your e-commerce site than in your physical stores might suggest:
- A need for in-store team training
- Better digital experience ergonomics
- Different customer expectations depending on the channel
Actions to Implement Based on NPS Score
For a Negative Score (< 0)
The priority is to identify and address major sources of dissatisfaction. Focus on:
- Detailed analysis of detractor comments
- Implementation of urgent corrective action plan
- Close monitoring of satisfaction indicators
For an Average Score (0-30)
The goal is to progressively optimize customer experience:
- Identify your strengths to capitalize on them
- Work on converting passives to promoters
- Implement tracking indicators for each touchpoint
For a High Score (> 30)
Maintain your excellence while innovating:
- Document your best practices
- Test innovations to positively surprise your customers
- Mobilize your promoters as ambassadors

FAQ: Your Questions About NPS Calculation
🧮 How to Calculate NPS Simply?
NPS calculation involves three simple steps:
- Calculate the percentage of Promoters (scores 9-10)
- Calculate the percentage of Detractors (scores 0-6)
- Subtract the percentage of Detractors from the percentage of Promoters
The formula is: NPS = % Promoters – % Detractors. For example, with 40% Promoters and 20% Detractors, your NPS will be 20.
⏰ What’s the Ideal Frequency for Calculating NPS?
Calculation frequency depends on your industry:
- For B2B: Quarterly calculation recommended
- For B2C: Monthly or bi-monthly calculation advised
- After each important customer interaction: Immediate calculation
The key is maintaining regularity in your measurements to track evolution.
🎯 How to Know if an NPS Score is Good?
NPS scores vary by industry:
- E-commerce: a good score is > 45
- Financial services: a good score is > 34
- Traditional retail: a good score is > 30
Generally, any positive score is encouraging, and above 50 is considered excellent.
😐 Are Passives Counted in NPS Calculation?
No, passives (scores 7-8) are not directly counted in the NPS formula. They only serve to calculate the total number of respondents to obtain percentages. Including them in the final calculation is a common mistake.
📊 How Many Responses are Needed for a Reliable NPS?
To obtain a statistically reliable NPS, you need:
- Minimum: 100 responses
- Ideal: 200-300 responses
- For fine segmentation: > 300 responses
Too small a sample can give unrepresentative results.
📈 How to Improve a Negative NPS?
To improve a negative NPS:
- Analyze detractor comments in detail
- Identify main friction points
- Implement a corrective action plan
- Closely monitor improvements
- Contact detractors after corrections
🎯 Can NPS be Calculated by Customer Segment?
Yes, it’s actually recommended to segment your NPS by:
- Customer tenure
- Sales channels
- Product categories
- Geographic areas
This segmentation enables more targeted corrective actions.
⚖️ What’s the Difference Between NPS and CSAT?
NPS measures loyalty and likelihood to recommend, while CSAT (Customer Satisfaction Score) measures immediate satisfaction. NPS is more predictive of long-term growth, while CSAT is more useful for evaluating specific interactions.
💬 How to Leverage Customer Comments in NPS Calculation?
Comments should be:
- Systematically collected with the score
- Analyzed by problem categories
- Used to contextualize the score
- Transformed into concrete improvement actions
They are essential for understanding the reasons behind the score.
🛠️ What Tools are Needed to Calculate NPS?
Several options are available:
- Excel/Google Sheets (for small volumes)
- Specialized tools like Drag’n Survey, SurveyMonkey, or Typeform
- CRM solutions integrating NPS
- Dedicated customer experience platforms
The choice depends on your data volume and analysis needs.
🎮 How to Integrate NPS Calculation into Customer Strategy?
NPS should be:
- Integrated into main company KPIs
- Regularly monitored in management meetings
- Linked to team objectives
- Used to guide improvement decisions
- Regularly communicated to teams
🏢 Is NPS Calculation Different for B2B and B2C?
The formula remains the same, but specificities change:
- B2B: Focus on long-term relationships, less frequent measurement
- B2C: More frequent measurement, higher response volume
Benchmarks and interpretations vary by sector.
More about surveys:
Test a Google Forms alternative, click here
Exploring Top Online Survey Tools, click here
Compare Drag’n Survey and Survio, click here
Survey Creation Apps for Your Needs, click here
Discover software for creating quizzes, click here
The most popular online survey solutions, click here
The features of Drag’n Survey and Typeform, click here
Create an online survey with a multilingual tool, click here
How to effectively measure customer satisfaction, click here
Drag’n Survey, the multilingual online poll software, click here
The differences between Drag’n Survey and SurveyMonkey, click here
Read the article:
Polish – kalkulator NPS, click here
German – NPS-Rechner, click here
French – Calculateur Net Promoter Score , click here
Portuguese – Calculadora Net Promoter Score, click here