Many researchers use surveys as their most popular data collection technique. Interestingly, 52% of survey participants provide more honest answers when kept anonymous.
Managers are poised to gain deeper insights into their business’s strengths and weaknesses, empowering them to make informed decisions regarding their products or services. Similarly, surveys provide a platform for bosses to pinpoint areas requiring improvement within the business, thereby catalyzing management decisions to enhance overall performance.
The article below examines the concept of surveys and explains what leaders need to know about using them. Participating in surveys gives leaders a chance to learn the opinions, reactions, and views of a vast number of people, be they employees, customers, or even the public at large.
>> To create an online survey on the Drag’n Survey software, click here

Designing Effective Surveys
Designing effective surveys requires careful planning and consideration of several key factors. Here are a few of those factors:
Identify the Target Population and Objectives:
- Who is this survey for? What exactly does the survey want to know?
- What are the goals of this research that will influence what questions are asked and how results are distributed?
Craft Clear and Unbiased Questions:
- Keep questions short, clear, straightforward, concise, unambiguous, simple and free from leading or biased language
- Make a judgment about their level of knowledge or level of experience as well as the appropriateness of these questions.
Choose the Right Survey Type and Distribution Channels:
- This may include online surveys, phone interviews, or in-person questionnaires.
- Determine which method will be most suitable based on factors such as ease of access to respondents and convenience for subjects.
Determine Distribution Channels:
- These may include email platforms like newsletters; social media networks like Facebook; online forums; blogs; Twitter handles etc
- Consider target population preferences as well as habits so that they can improve response rates.
Data Collection Methods
Data collection methods are fundamental in acquiring accurate and reliable information for research or analysis purposes. Here are several commonly used methods, along with their educational details:
- Online Surveys: Online surveys have gained popularity due to their convenience and accessibility. They offer flexibility, allowing respondents to answer questions at their own pace and in their own time. This often results in a larger sample size and faster data collection.
Benefits: Real-time results and easy analysis using data analysis software.
- Telephone Interviews: Telephone interviews involve contacting respondents via phone and conducting structured interviews.
This method allows for direct interaction between the interviewer and the respondent, enabling clarification of questions or probing for more detailed responses.
Considerations: Time constraints and potential bias due to subjective interpretations.
- Paper Questionnaires: Paper questionnaires are traditional tools involving physical distribution and collection of questionnaires.
They are useful when targeting populations without online access or in areas with limited internet connectivity.
Challenges: Manual data entry, potential errors, or lost questionnaires.
- Face-to-Face Interviews: Face-to-face interviews involve meeting respondents in person to gather data. This method provides in-depth insights and non-verbal cues that may be missed through other methods.
Considerations: Time-consuming, costly, and dependent on participant availability and willingness.
Preparing Data for Analysis
Data preparation or making data efficient and suitable for analysis, appears as an unavoidable process in any research project or data analysis.
Such a task implies several main stages, starting with data verification and error detection, handling numerous cases when information or responses are missing or cut short, and coding for open-ended messages.
Data cleaning and validation is the procedure of checking for and fixing incorrect, inconsistent, and flawed data. This could mean deleting the duplicate files, fixing the records that were incorrectly classified or misentered, arranging the data in a proper format and structure, and making sure it follows the establishment standards.
In data preparation, not accounting for mixed or incomplete answers is another essential part. Particularly for missing or despiteful responses, there is a possibility of incomplete/incoherent answers as well, in the case of the participants who didn’t answer all questions or gave conflicting answers.
Researchers must decide hereby how to address circumstances of hidden or conflicting data points because missing values are filled in, incomplete cases dropped from analyses or sensitivity analyses.
Coding open-ended responses comprises a technique utilized for coding qualitative data, expressing it quantitatively. Researchers try to pinpoint the meanings in the unstructured answers, and then these meanings are assigned codes or categories that represent one or more themes or topics.
This implies the combination of qualitative and quantitative info. Therefore, qualitative data is used as the source of qualitative analysis.
Tools for Analyzing Survey Data
When it comes to analyzing survey data, several tools are available to aid in the process.
- Microsoft Excel: Microsoft Excel is a widely used spreadsheet software known for its versatility in handling data.
- Benefits: It offers basic data analysis functionalities such as sorting, filtering, and basic statistical analysis. Excel is user-friendly and readily available to many users.
- Google Sheets: Google Sheets is a cloud-based spreadsheet software similar to Excel, accessible through a web browser.
- Benefits: Collaborative features allow multiple users to work on the same spreadsheet simultaneously. It also integrates seamlessly with other Google Workspace tools.
- Drag’n Survey: Drag’n Survey is an online survey platform enabling users to create and distribute surveys easily.
- Benefits: It offers a user-friendly interface with drag-and-drop functionality for designing surveys.
Drag’n Survey provides features for customization, respondent management, and real-time data analysis, making it suitable for both simple and complex survey projects.
Techniques for Meaningful Insights
As a part of data analysis, several such techniques remain very disciplined to generate sense-filled outcomes, and to a great extent decision-making based on the data pattern has become a reality. Here are five techniques:
- Descriptive Statistics:
- Provides a summary of central tendency and variability using measures such as mean, median, mode, and standard deviation.
- Benefits:
- Helps understand data characteristics and distribution.
- Provides insights into dataset variability.
- Cross-Tabulation:
- Compares subgroups within a dataset by examining relationships between categorical variables.
- Benefits:
- Identifies patterns or associations within the data.
- Facilitates a deeper understanding of underlying factors influencing the data.
- Trend Analysis:
- Examines data points over time to detect long-term trends, seasonal variations, or cyclic patterns.
- Benefits:
- Spots patterns and changes in data over time.
- Aids in forecasting and understanding the dynamics of a phenomenon.
- Sentiment Analysis:
- Analyzes qualitative data (e.g., text, social media posts) to gauge attitudes and emotions using natural language processing techniques.
- Benefits:
- Uncovers insights from large volumes of unstructured data.
- Helps understand sentiments and attitudes towards a topic.
- Regression Analysis:
- Predicts outcomes based on independent variables, establishing relationships and quantifying the impact of various factors on a dependent variable.
- Benefits:
- Identifies key drivers of change.
- Helps make informed decisions based on relationships between variables.

Data Visualization and Reporting
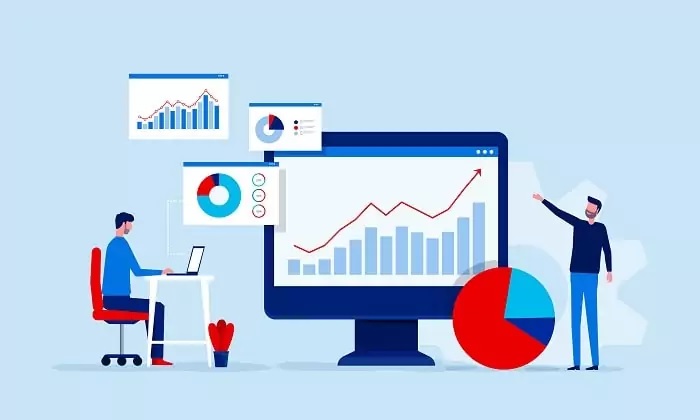
Data visualization is a potent means of providing information to the public within a limited time range. Feeding your data with the chart type best for the data such as bar chart, pie chart, line graph; etc will help convey your message to others.
As one might guess, bar charts show the various values across the categories you compare, enabling viewers to quickly observe the differences.
Pie charts could be definitely and even this they are excellent to show the parts of the data set or the percentage of data. Therefore it seems easy to understand what is the proportion of the data set. Line graphs perfectly visualize long-term trends or the correlation assumed between the dependent and independent variables.
Dashboards are additionally an integral action in data visualization as the responding part of interactive insights.
The dashboards allow users to get involved with the data and look at different issues and insights that are meaningful and valuable. It provides a go-to scenario when directors and managers make decisions based on real-time data.
Accurate and precise content delivery while reporting findings is indispensable to successful research. To gain the attention and approval of the audience, precise language structure and a variety of visual aids are crucial for flagging the audience’s attention to the key messages and conclusions.
Lastly, it is important to personalize the report for different audiences. It will be very difficult for stakeholders with different literacy levels and interests in certain topics to get the same message across.
Through this way, you can customize the report to address particular issues and concerns they are facing, which in turn can come through effectively as they get the data insights and drive the action as well.
Ethical Considerations and Data Privacy
Ethical debates and questions of data privacy are two key issues when it comes to the implementation of surveys and the ability to process the results.
Privacy and trustworthiness are of great significance during the undertaking of the survey; hence all the same, the interviewees’ anonymity and confidentiality should be upheld.
This signifies that the data related to the individual and identifiable marks applied during the survey should be stored and kept in a secure place and away from unauthorized entries.
Consequently, researchers should never collect any extra personal information and inform the participants of the goal of the survey (i.e. type of data), and how this data will be used, and expect the respondents to give it only if they will.
To ensure that participants consent to us collecting any personal information, we should collect any personal information and clear opt-out options should be provided to participants before any data collection.
Additionally, the secure handling and storing of survey data is identified as a crucial process. Such securities can be achieved via encryption and secure servers, as well as the limited access of only authorized personnel to them as this is viewed to be very sensitive and vulnerable.
Data stored should be retained for a minimum period plus one more session and disposed of properly to avoid possible security breaches or misuse.
From the ethics perspective, the researchers are responsible for applying the insights obtained from the survey data ethically and responsibly.
This means keeping the data exclusively for the announced aims, and any synthesis or conclusion of the data being done truthfully and honestly. The principle of privacy should be. The public should not know any personal or sensitive information the respondent disallowed from being used or disclosed.

Best Practices and Common Pitfalls
Survey research is a widely used method for collecting data in various fields, such as social sciences, marketing, and psychology. To ensure the reliability and validity of survey instruments, it is crucial to follow best practices while avoiding common pitfalls.
Common Pitfalls:
- Biases in Data Analysis:
- Cherry-picking data, ignoring contradictory findings, or misinterpreting results to fit preconceived notions can lead to biased interpretations.
- Overgeneralization of Results:
- Misinterpreting survey findings as applicable to the entire target population without considering the limitations of survey research.
- Failure to Address Survey Design Issues:
- Using poorly designed survey instruments that lack clarity, are ambiguous, or do not align with research objectives can compromise data quality.
Best Practices:
- Use Well-Designed Survey Instruments:
- Ensure clarity, lack of ambiguity, and alignment with research objectives in survey instruments.
- Pretest questionnaires on a small sample to identify and address issues in wording, response options, or skip patterns.
- Include demographic questions to control potential confounding variables during data analysis.
- Maintain Objectivity in Data Analysis:
- Strive to maintain objectivity and eliminate biases that may skew results.
- Analyze data objectively without letting personal biases influence interpretations.
- Accurate Interpretation of Results:
- Interpret results accurately without overgeneralizing, keeping in mind that survey findings are representative of the sampled population.
- Acknowledge and address the limitations of survey research, such as response bias or the inability to establish causality.
Final Thoughts
Survey analysis covers a variety of techniques and instruments for data collection and analysis which would not be possible without the advantage of their efficient use. Such tools are basic in online survey platforms, data visualization software, and statistical analysis packages.
The continual learning and the adaptability of the survey results analysis are vital and cannot be overemphasized. This is a great thing, and it is a given that a new study methodology along with the new technology shall be available shortly.
Experts are to keep track of any new achievements in the field and continuously upgrade their skills to deliver the most precise insights in times of crisis. The level of keeping pace with developments is very vital and staying informed, as well as adapting approaches accordingly, is crucial for survey analysts to utilize the survey research to achieve maximum benefits.
More about surveys:
Searching for a Jotform Replacement, click here
Evaluating Different Options to Typeform, click here
The Best Software for Creating Online Polls, click here
Discovering New Solutions to Replace Google Forms, click here
Essential Software for Crafting Interactive Online Quizzes, click here
Considering Other Form Builders Instead of SurveyMonkey, click here
